Summary
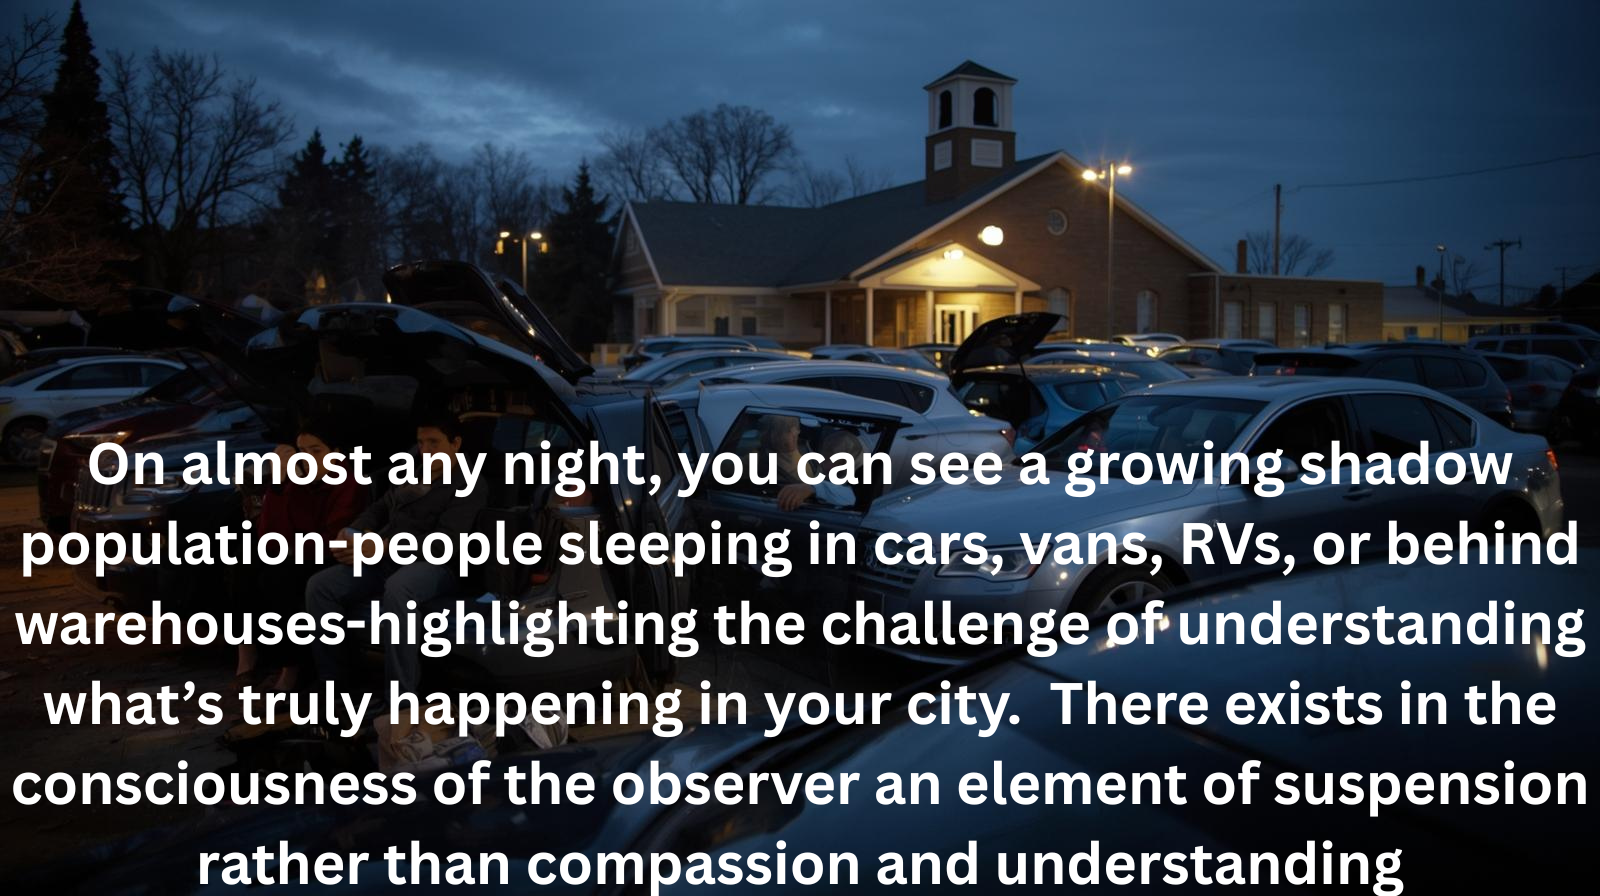
There is a misconception among many observers that the occupant is a loser, mentally ill, on drugs, or some metric of society’s outcasts. Rarely is there a consideration that economic realities dictate that living in a car is the only solution for many. And, for most, it is a temporary condition.
Economic realities in the USA are dire for many low-paid or unemployed people. In many cases, it is systemic rather than attributable to individuals’ poor choices. Or, it is a combination of both.
In most places, it’s less a conspiracy than a reality: we’re trying to measure a moving, partly hidden population with tools designed for the stationary and visible. The result is a system that produces numbers that can appear overly confident, while still leaving significant gaps.
Here’s what’s going on, and why vehicle homelessness is so hard to count.
My personal estimation is that at least 3,000,000 people are homeless. Including those living in their cars or RVs, or staying in interim motels, highlights how many are quietly facing hardship. While exact statistics are difficult to obtain, recognizing that living in a vehicle provides some protection from the elements can foster understanding and compassion.
6,000,000/ 360,000,000 occupants in the USA= 1.67% or roughly 2% of the American population, legal and illegal. These numbers could be 2 times higher because the underlying statistics are concealed.
The Core Problem: We Count a Crisis Like It’s a Snapshot
The headline homelessness figures most communities cite come from the Point-in-Time (PIT) count, which is conducted on a single night in January.
While the PIT count helps track trends, understanding its limitations is crucial because it’s a snapshot that can unintentionally overlook the complex reality of homelessness, emphasizing the challenge of measuring a moving target. Recognizing these measurement challenges can foster empathy and patience among policymakers and social workers as they work to address homelessness.
PIT is a photo, not a documentary.
1) The PIT Count Misses People Who Aren’t Visible That Night
On the designated night, volunteers and outreach teams search for individuals who appear to be sleeping outdoors or in places not intended for habitation. At the same time, shelters provide counts of people inside.
But many people experiencing homelessness do not fit neatly into those categories on that night:
- Some stay with a friend temporarily (“couch surfing”).
- Some pool money for a motel for a week.
- Some go to an emergency room, a detox facility, or a short-term program.
- Some move to avoid contact with police or security.
So the PIT tends to count what’s easiest to see—not necessarily what’s most common.
A one-night census can’t capture a year-round crisis—especially when survival often means staying invisible.
2) “Hidden Homelessness” Isn’t a Rounding Error—It’s a Different Reality
The hardest group to count is often the one people notice most: those living in vehicles.
Why? Because vehicle homelessness is designed for concealment. People park where they won’t be noticed, rotate locations, block windows, and avoid interactions that might lead to tickets, towing, or worse. Recognizing these safety and privacy concerns can help foster understanding and compassion for those living in vehicles, encouraging the public and advocates to see beyond surface appearances.
And in many communities, “sleeping in a car” isn’t just a last resort—it’s a strategic choice: staying close to work, school, and safety, which underscores the need for understanding and compassion.
GAO specifically highlights how difficult it is to count people living in cars, abandoned buildings, and other hidden places—some of whom do not want to be found.
Another reason the numbers feel slippery: different agencies use different definitions of homelessness. Understanding how varying definitions affect data accuracy can help the audience grasp why statistics may not always tell the full story and why caution is needed when interpreting these figures.
Another reason the numbers feel slippery: different agencies use different definitions of homelessness.
For example, the education system uses the McKinney-Vento definition for students, which explicitly includes children and youth who are:
- doubled up due to hardship,
- living in motels,
- or living in cars, parks, public spaces, or similar settings.
Housing programs funded by HUD generally track homelessness using the PIT framework and related eligibility rules, which can be narrower in practice than the school-based count.
Translation: the public school may identify a child as homeless, while the Housing system’s headline figure may not reflect that same child, because the systems are measuring different things.
When the definition changes, the “truth” changes—even if the family’s situation doesn’t.
4) The Incentives Are Complicated—and They Shape What Gets Measured
Most people assume higher numbers automatically mean more funding. Sometimes that’s true. But locally, the incentives can pull in opposite directions.
A large reported homeless population can:
- signal policy failure (politically damaging),
- create public pressure,
- trigger business backlash,
- or affect perceptions of safety and investment.
At the same time, those numbers can influence planning and resource allocation tied to federal reporting.
That combination creates what many residents sense as a “tug-of-war.” It may not be a coordinated cover-up, but it can become a quiet cultural pressure: don’t count too aggressively, don’t publish too bluntly, don’t inflame the debate.
Because the PIT count is planned and conducted locally, methods vary, adding another layer of uncertainty. GAO has also found that year-to-year swings in local counts can raise questions about data accuracy and consistency.
5) Data Lives in Silos—And Privacy Rules Make It Hard to Merge
Even if we wanted a real-time, unified total, the information is scattered:
- Schools track homelessness among students.
- Hospitals see patients who list “no fixed address.”
- Outreach teams maintain case notes.
- Food banks and nonprofits track service encounters.
But those systems typically don’t combine into one master count—partly due to technical barriers, and partly due to privacy and consent rules.
HUD’s HMIS (Homeless Management Information System) is designed to collect and share data across homelessness services, but it operates under strict privacy and security standards and must protect sensitive information.
This is why the public often hears one official number—while multiple “partial truths” exist across different agencies.
We don’t have one homelessness database; we have many—each seeing a piece of the storm through a different window.
So Are the Numbers “Secretive”?
Sometimes, yes, public communication can feel guarded. But more often the secrecy is accidental: it’s what happens when a society relies on a single-night headcount to describe a daily-changing, partially hidden condition.
The PIT count remains the most widely cited benchmark because it’s standardized and required for reporting. But GAO and other reviewers have been blunt about the limitations: the official totals likely undercount reality, and methods can vary enough to create inconsistent results.
A Better Way to Think About the “Real Number”
If you want a more realistic understanding, don’t ask for a single perfect figure. Ask for a range based on multiple sources:
- PIT count (snapshot)
- school district McKinney‑Vento data (annual flow of student homelessness)
- HMIS trends (service utilization over time)
- hospital and public health indicators (where data-sharing is lawful and feasible)
That’s how you get closer to “real”: by combining snapshots with ongoing signals.
Summary
- The PIT count occurs on a single night in January, so it misses individuals who are temporarily indoors or hidden.
- Vehicle homelessness is especially hard to verify safely, so it’s often undercounted.
- Different definitions create different totals, especially between Housing systems and schools.
- Local incentives and inconsistent methods can affect counting intensity and comparability.
- Privacy and siloed data systems make it difficult to build a single unified, real-time total.