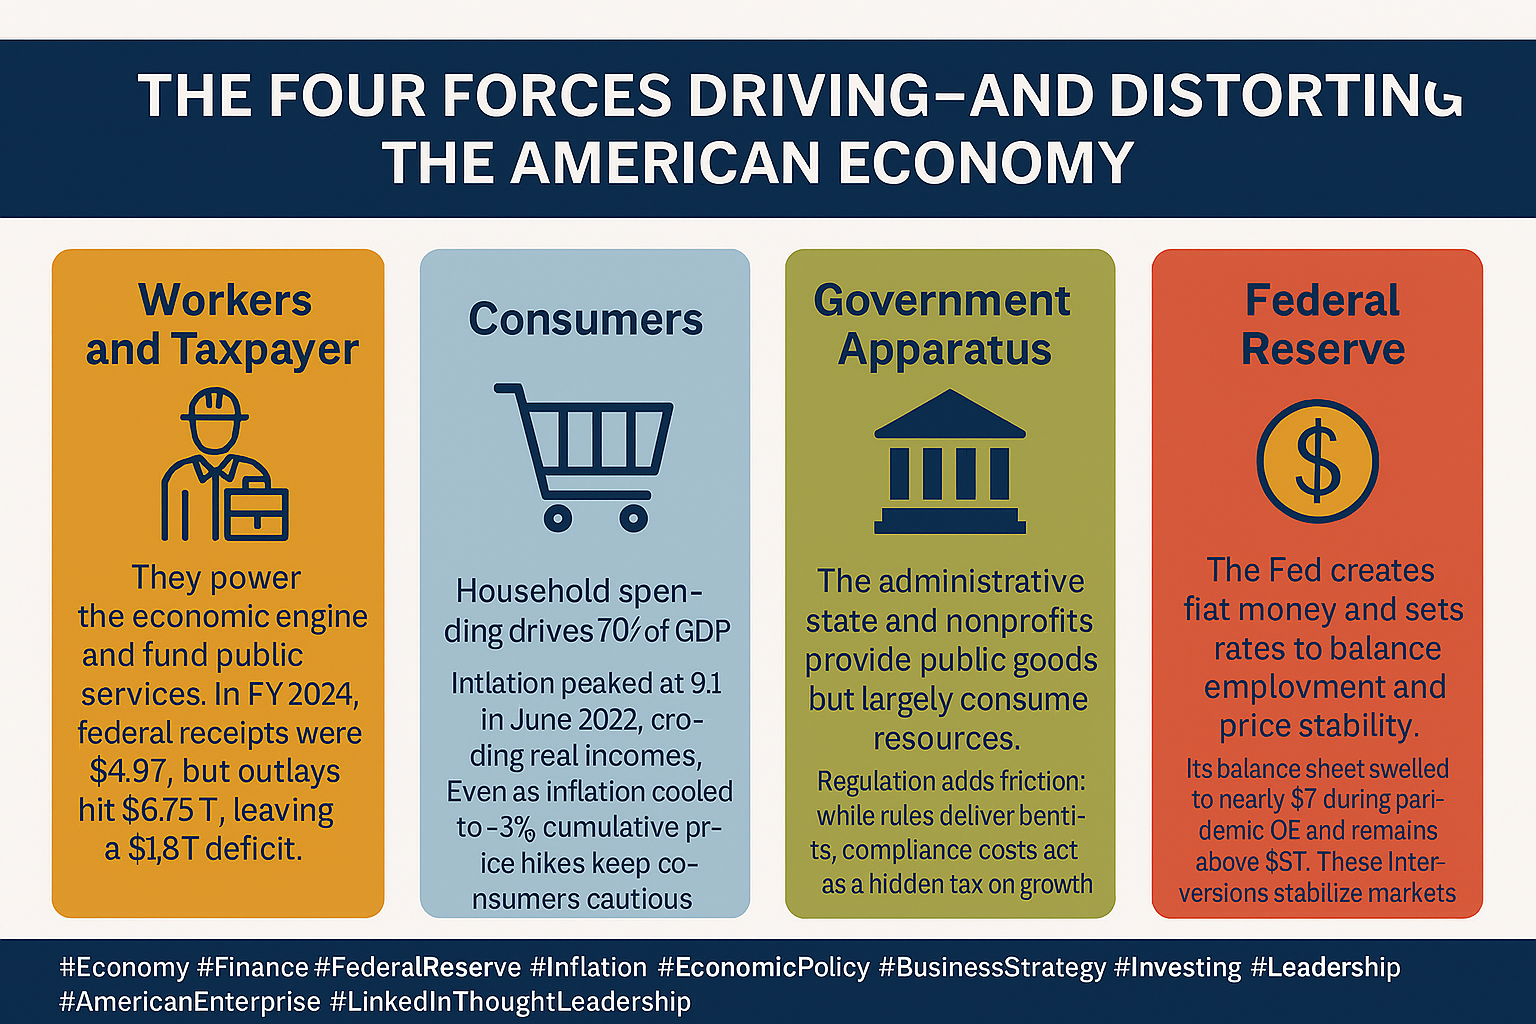
American enterprise runs on four interlocking components: the worker–taxpayer, the consumer, the government apparatus, and the Federal Reserve System.
Workers supply the productive effort and tax revenue; consumers propel demand; the government coordinates and compels through laws, programs, and regulations; and the Federal Reserve manipulates the cost and quantity of money. The balance among these four determines whether growth compounds—or whether policy frictions and money distortions erode purchasing power and confidence.
1. The Worker and Taxpayer: The Economic Engine and Fiscal Base
The U.S. civilian labor force now stands around 171 million people (seasonally adjusted), the broadest measure of Americans working or seeking work.
https://fred.stlouisfed.org/series/CLF16OV/
Their wages and business income underwrite both private consumption and public sector expenditures. In FY2024, federal receipts totaled approximately $4.9 trillion, while outlays reached roughly $6.75 trillion, resulting in a deficit of $1.83 trillion (6.4% of GDP).
Taxpayers also carried a net interest bill of nearly $8 billion to 1–$949 billion in FY2024, a striking illustration of how higher rates and larger debt stocks redirect national income from productive uses toward servicing past borrowing.
Why it matters: The expansion of employment and productivity directly influences taxable income and payroll, thereby stabilizing public finance without the need for rate hikes. Conversely, any weakness in the labor market leads to lower receipts and higher safety-net spending, which in turn widens deficits and escalates future interest costs. These pressures ultimately fall back on the same worker–taxpayer base, underscoring their pivotal role in the economic system.
Example: The labor force has climbed above its pre-pandemic level, a testament to the resilience of the American worker-taxpayer base. However, the scale and composition of work—primarily participation among prime-age individuals, small business formation, and hours worked—determine how much real value (and revenue) the economy generates. Policymakers ignore those micro‑drivers at their peril.
2. The Consumer: Roughly 2/3 of GDP—and the Business Cycle’s Center of Gravity
U.S. personal consumption expenditures (PCE) consistently account for ~67–70% of GDP, making household demand the decisive arbiter of corporate revenues and investment plans. This highlights the significant Impact of consumers in shaping the business cycle.
During the Q2 2020 pandemic shock, real GDP collapsed at a 31.7% annualized rate, with contraction in PCE leading the decline—proof of how sensitive overall output is to a pullback in household spending.
Signals to watch. Confidence indicators—the Conference Board’s Consumer Confidence Index and the University of Michigan’s Sentiment Index—are closely tracked because they often precede changes in spending. Today, both series suggest caution relative to the 2021021–2022 peaks, even as spending has proved more resilient than sentiment would imply in some periods.
Prices and purchasing power. The inflation spike, which peaked at 9.1% year-over-year CPI in June 2022, damaged real incomes and forced households to trade down or delay purchases. Disinflation has since brought the 12-month CPI to ~2.9% (December to December 2024; a similar pace as of August 2025), but cumulative price levels remain higher, keeping value-conscious behavior at the forefront for retailers and lenders.
Example: In 2022–2024, households demonstrated their adaptability by rotating between goods and services, then toward “experiences,” even as sentiment readings lagged. This decoupling—weak sentiment alongside stable spending—has complicated forecasting and highlights how access to credit, housing wealth, and wages can temporarily boost consumption.
3. The Government Apparatus: A Resource-Consuming Component of Public Goods—with Frictions
The modern government apparatus encompasses the administrative state, various agencies, public institutions, and a substantial nonprofit ecosystem. Nonprofits alone account for ~12.8 million jobs —nearly 10% of private employment —concentrated in health care, education, and social services—roles that are mission-driven but funded by taxes, philanthropy, and public reimbursements.
On the fiscal front, federal outlays reached about $6.75 trillion in FY2024, with Social Security (~$1.46T), Medicare (~$874B), health (~$912B), defense (~$874B), and net interest (~$881B) among the largest line items.
This apparatus produces public goods (such as national defense, courts, infrastructure, and education) and redistributes income. Still, in national accounts, much of its output is measured as “government consumption expenditures and gross investment”, not market-priced value added—hence its status as a net consumer of resources in the private‑market sense.
Regulatory drag vs. benefits. The OMB’s annual report to Congress tallies agency-estimated benefits and costs of major rules, noting both the intended gains (safety, environmental quality, consumer protections) and the burdens on growth and employment.
At the same time, private-sector analyses (e.g., National Association of Manufacturers) estimate substantial compliance costs, especially for smaller firms, highlighting how bureaucracy can compress margins and slow project timelines. (Methodologies differ; the larger point is that friction is real, even when a rule’s social benefits are positive.)
Example: Rising net interest crowds out program dollars; however, the American government apparatus efficiently manages these challenges. Every incremental percentage point in borrowing costs ripples through budgets, shifting scarce resources from productive services and capital to debt service, without improving current public services.
4. The Federal Reserve System: Money Creation, Rate Policy, and a Persistent Counterforce
The Fed creates base money and steers interest rates to pursue its dual mandate—maximum employment and price stability (2% PCE inflation over time)—primarily via open‑market operations (buying/selling Treasuries and agency MBS) and liquidity programs.
In crises, it deploys quantitative easing (QE) and emergency facilities, swelling its balance sheet; in recoveries, it attempts “quantitative tightening (QT).”
The Fed’s consolidated assets peaked near $8.9 trillion in 2022 and, after QT and the wind-down of crisis facilities, measured approximately $6.6 trillion as of 24 September 2025 (H.4.1/WALCL).
The 2023–2024 Bank Term Funding Program—created to stabilize banks after rate shock losses—has been wound down, with balances expected to return to zero by 2025.
The counterforce dynamic is crucial to understand. When the Fed expands money and suppresses yields, it props up asset prices. It cheapens credit—supportive in panics—but risks eroding purchasing power if demand outstrips supply. When it reverses—raising rates and shrinking the balance sheet—borrowing costs rise, asset valuations compress, and cash flow coverage tightens, often curbing consumer and business spending. This understanding is key to predicting and managing the potential Impact of the Fed’s actions on the economy.
Example: Extraordinary QE during 2020–2021 backstopped markets and helped prevent a Depression, but the after‑effects—combined with fiscal stimulus and supply bottlenecks—fed a price surge that peaked at 9.1% CPI YoY (June 2022). The subsequent tightening cycle pulled inflation closer to target but at the cost of higher debt‑service burdens across households, firms, and the Treasury.
5. How the Four Components Interact
- Workers ↔ Consumers Wage growth fuels consumption, which in turn supports employment. Persistent real‑income erosion (inflation above wage gains) breaks the loop.
- Government ↔ Workers/Businesses. Tax and regulatory regimes shape hiring, investment, and innovation. Compliance costs and permitting delays operate like a shadow tax—even when rules deliver genuine social benefits.
- Government ↔ Fe. Large, persistent deficits raise the economy’s sensitivity to rate hikes; net interest outlays become a binding constraint. If fiscal policy stays expansionary while the Fed is tightening, the two forces can work at cross‑purposes.
- Fed ↔ Consumers/Markets. Monetary easing bolsters spending and asset values; tightening dampens them. Confidence surveys often exceed complex data, but credit conditions ultimately determine what households actually buy.
Bottom Line
- The worker–taxpayer is the indispensable engine. Maintaining a dynamic employment market and rising productivity will lead to fiscal stability.
- The consumer remains the swing factor (~ two-thirds of GDP). Watch sentiment, credit conditions, and real incomes to anticipate turning points.
- The government apparatus provides necessary public goods but is a net resource-consuming market, and can become a drain on profitability when regulation and interest costs outpace growth.
- The Federal Reserve stabilizes in crisis but can distort price signals when extraordinary policies linger; then it must reverse course, often painfully.
Strategic implication:
For lenders, builders, and operators, the sweet spot is aligning underwriting and pricing with (1) real wage trends, (2) the trajectory of PCE and confidence, (3) the local regulatory/permitting environment, and (4) the Fed’s balance‑sheet and rate path. That is where the four components intersect in the profit and loss (P&L) statement.
Sources (Selected)
- Labor market & consumers: BLS CPS labor force; BEA PCE share of GDP; BEA GDP releases; Conference Board CCI; Univ. of Michigan sentiment.
- Inflation: BLS CPI (2024 in review; 2025 updates; June 2022 peak).
- Fiscal: CBO Monthly Budget Review FY2024; U.S. Treasury/Fiscal Service outlays by function.
- Government accounts & nonprofits: BEA NIPA (government consumption & investment); BLS Nonprofit Sector research.
- Regulation: OMB Benefits & Costs reports; NAM regulation cost study.
- Federal Reserve: Fed’s H.4.1 and WALCL; Fed timeline on balance‑sheet policies; CRS/Investopedia primers on how QE works.